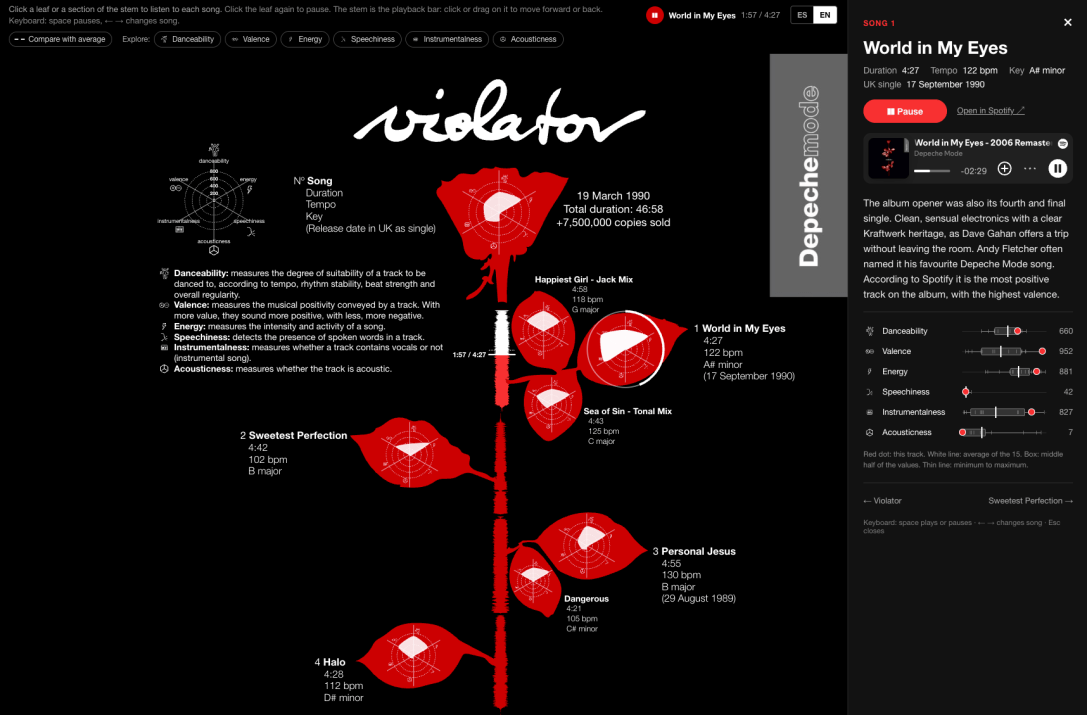
A few years ago I made a static infographic about Violator, probably the best Depeche Mode album (a band that has left a mark on me, as you all know). Today, with a little help from AI, I have managed to make that infographic play too: you tap a leaf of the rose, listen to the song and read some curiosities about it at the same time.
You can try it here: javicanton.github.io/violator-dataviz.
Where did the rose come from?
The original infographic dates from March 2022. I wanted to apply what I was learning about data visualization to a project of my own, and I chose music. Within it, Depeche Mode, and within their catalogue, Violator (1990), probably the record that took them to the whole world. Following the original cover design, a red rose with white spots on a black background, each song is a leaf of the rose, and each leaf is a radar chart with six audio features that Spotify calculates for every track (which forms the white leaf). I pulled the data with R and the spotifyr package, built the radars with Flourish and put everything together in Adobe Illustrator, as I explained in the original post. My first idea was to place the audio waves inside the leaves. After a chat with the great Ferrán Morales, I took them out and made them the stem of the rose, using waveforms generated with WaveFormer, by Misha Heesakkers. That decision is what made this version possible. But it was still a poster (a really cool one that I printed, and that I also turned into a super-t-shirt), and I was left itching for the audio. Fixed!
How do you listen to it?
I kept the rose as it was. Each leaf is the radar of a song, showing danceability, energy, speechiness, acousticness, instrumentalness and valence. There are fifteen tracks: the nine on the album and six B-sides. The rose in the middle is the average of the fifteen. What is new is that the stem of each leaf, the waveform of the song, is now the playback bar:
- Click a leaf or a stretch of the stem to hear the song.
- Click the leaf again to pause.
- Click or drag along the stem to skip forward or back.
- When an album song ends, the next one starts.
Important notice for fellow navigators: the song plays in full only if you are logged in to Spotify in that browser. Otherwise Spotify only allows a 30-second excerpt, and the page tells you so.
What else can you do?
Moving it to the web, I took the chance to add interactivity, and a few other things. The data is still there, and now you can question it in several ways:
- Values on hover. Each axis of the radar shows its exact value.
- Compare with the average. A dashed line draws the average profile of the fifteen tracks over each leaf, so you can see how a song departs from the whole.
- Explore by feature. Pick one, say energy, and the rose lights up according to it: more light means a higher value, and each leaf carries its rank among the fifteen.
- Box plot. In each song’s panel, every metric is placed on the distribution of the fifteen tracks, with the average marked.
- Map of studios. Where the album was recorded: Milan, Gjerlev (Denmark), London and New York, with what is known about each session.
- Keyboard. Space to play or pause, arrow keys to change song and Esc to close the panel.
It is also available in Spanish and English, works on mobile, and every song has its own link, in case you want to share a specific one. For the box plot I chose that form over a violin because with only fifteen values a violin draws a silhouette the data cannot support.
How did I make it?
It is a static page in HTML, CSS and JavaScript with D3, with no server and no build step, published on GitHub Pages. I wanted it to be easy to host, to review and to copy in order to learn.
- Data. The features of the fifteen tracks come from a spreadsheet with Spotify’s Violator (2006 Remaster) edition, converted into a JSON file the page reads.
- Stem. Each stem is drawn from the song’s waveform, which I already had from the 2022 version.
- Sound. I use Spotify’s embedded player, controlled from the page so that the leaf and the stem follow what is playing.
- Texts. Each song has a short text in Spanish and English, kept in a separate file so it can be edited without touching the code.
I checked the replica of the original design by overlaying it on the 2022 drawing, so that the interactive rose and the static one match.
License and links
The infographic is released under CC BY-ND 4.0: you can share it, crediting the author, but not modify it. The license covers my infographic and the visualization, not the music, the cover art or third-party marks. If the player does not load, it is almost always a content or tracker blocker. Turn it off for the page, or open the song in Spotify from the link provided. I hope you like it, and that you listen to it.
Repo available on: https://github.com/javicanton/violator-dataviz
And if you spot any mistake, or have a suggestion for improvement, don’t hold back and tell me!


